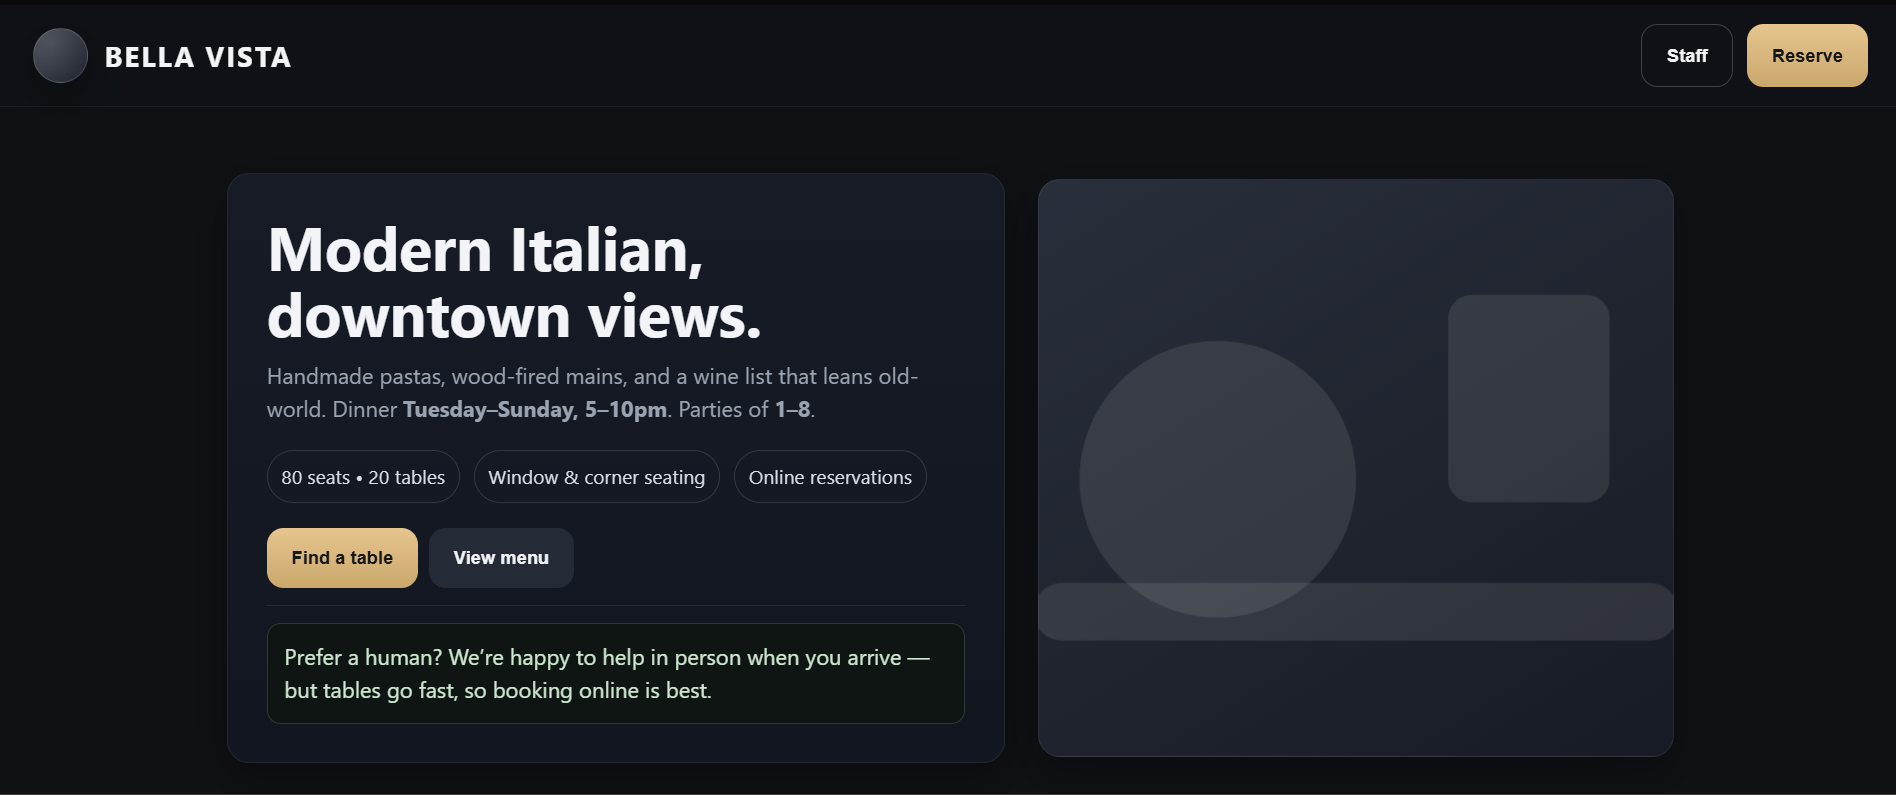
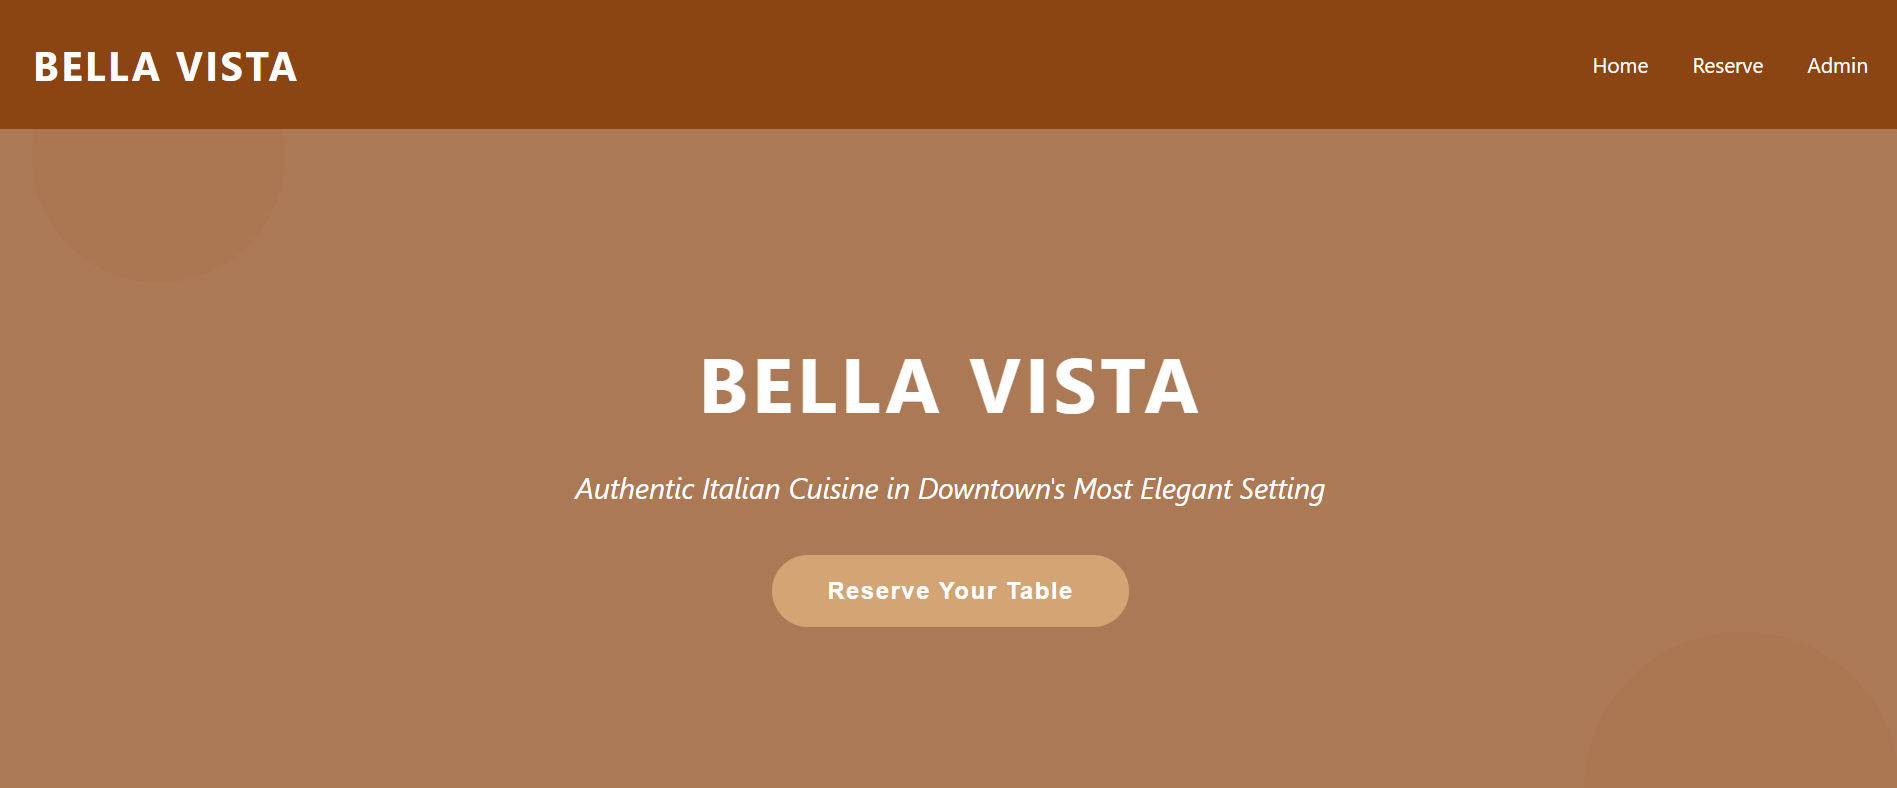
Vibe Coding? Your Agent explained its design and choices. Is it reflected in the Interface ?

Generative UI tools narrate their own design decisions: a three-column grid, accessible contrast, keyboard-navigable tabs. We built a benchmark to check whether those decisions are reflected in the interfaces they generate.

We call the gap Design Theater: plausible, confident design reasoning that bears little relationship to the artifact it describes.


0.75

Mean thinking fidelity - Roughly one in four stated design rationales never appears in the interface

34%

Failure rate on functional UI tasks

0.54

Mean adherence to UX principles in the prompt


Claude Artifacts

Claude

Bolt

Bolt

ChatGPT

ChatGPT

Vercel v0

Vercel v0

Firebase Studio

Firebase

All generated interfaces are browsable at Artifacts.

Start here

01

What user-facing design reasoning is

When you ask a code agent to generate an interface, it usually explains itself along the way: what it will build, which design principles it is following, which tradeoffs it is making. That explanation is written in the language of an expert designer. Yet nothing checks it against what gets built.

02

Why the gap matters

Design Theater is a performance of design expertise. A fluent rationale invites less scrutiny of the interface it describes, so the people now reviewing generated interfaces (product managers, engineers, first-time creators or non-designers) may trust an interface because its explanation sounds deliberate..

03

What the benchmark adds

Two metrics make two failure modes auditable: design rationales that were never implemented, and UX principles the prompt implied but the tool missed. A third metric studies design homogenization: how similar the interfaces are when different tools get the same prompt.


Paper - accepted, AIES 2026

Design Theater: A Benchmark for Generative UI


Abstract

Generative user interface tools promise to democratize UI design by turning natural language descriptions into complete interfaces. Tools such as Claude Artifacts, ChatGPT and Replit generate user-facing design rationales that explain their layout, accessibility and design choices. However, it remains unclear whether these stated rationales are actually reflected in the interfaces they produce. We call this disconnect “Design Theater”: plausible and confident design rationales that have little relationship to the actual implementation.

To study this phenomenon, we introduce a benchmark and three metrics for measuring Design Theater. The benchmark includes 24 UI generation tasks spanning structural, styling and functional design requirements. Using it, we evaluate 120 interfaces created by generative UI tools. On average, over 25% of user-facing design rationales are not implemented in the generated interface, and the implementation failure increases to 34% for functional requirements. Tools recognize roughly half of the UX principles embedded in prompts (mean = 0.54), with four of five tools implementing 6% or fewer functional principles.

We also measure interface similarity across tools and find signs of design homogenization, with relatively narrow pairwise differences in overall visual appearance and layout organization and greater spread in color choices. We discuss what these findings mean for the design and evaluation of generative UI tools.

Method

UI generation tasks, 5 tools, Three metrics.

Each code agent received the same design scenarios. For every output, we captured the code, the rendered interface, and all user-facing reasoning, both in the thinking trace and in the final response.


The prompts are written the way non-designers will prompt

Each prompt is a design scenario with two UX principles embedded in it. The prompt never names them. It describes users, contexts and constraints, and leaves the code agent to recognize which principles apply.

Tier 1 - Structural

What the interface contains

Information architecture: grouping related content, ordering sections, building navigation paths, routing distinct audiences, surfacing what is urgent. Eight tasks.

Tier 2 - Styling

How it looks

Visual communication: color, typography, spacing, hierarchy, contrast, emotional tone. Eight tasks, from straightforward branding to interfaces for constrained devices and readers under stress.

Tier 3 - Functional

How it behaves

Interaction: state, error prevention and recovery, user control, role switching, accessibility features. Eight tasks, from a four-step reservation flow to interactive systems serving large, diverse populations.


The three metrics

TFS

Thinking Fidelity Score

Did the tool build what it said it would?

We extract checkable claim from the reasoning trace - "a three-column grid", "keyboard-navigable tabs". Vague claims are discarded. Two evaluators score each claim against the artifact: fully implemented (1.0), partially (0.5), not at all (0.0).

TFS = (1.0 · Nfull + 0.5 · Npartial) / Ntotal  

PAS

Principle Adherence Score

To what extent do generative UI tools recognize and implement UX principles that are implicitly embedded in natural-language prompts (tasks)

Two target UX principles are chosen per prompt before evaluation - structural tasks from information architecture, styling from WCAG, functional from Nielsen's heuristics. Each scores 1 or 0; PAS is their mean.

DHI

Design Homogeneity Index

How similar are the interfaces produced by different generative UI tools?

All 120 interfaces are rendered as 1200 x 1200 screenshots giving ten pairwise comparisons per prompt. Similarity is kept as three separate dimensions:

Visual

UIClip embeddings.

Color

CIELCh + Earth Mover's Distance.

Layout

OmniParser v2 + tree edit distance.

Results

Cross-tool mean TFS was 0.75 - roughly one stated rationale in four did not fully appear in the interface. Four tools clustered between 0.74 and 0.87; Firebase Studio sat well below at 0.53.


Thinking Fidelity Score by tool

Claude 0.87
Bolt 0.84
ChatGPT 0.80
Vercel v0 0.74
Firebase 0.53
Table 1 - Mean TFS by tool and tier
Tool Overall 95% CI Structural Styling Functional
Claude 0.87 0.82–0.91 0.83 0.93 0.85
Bolt 0.84 0.75–0.91 0.83 0.95 0.73
ChatGPT 0.80 0.75–0.84 0.85 0.78 0.75
Vercel v0 0.74 0.63–0.84 0.83 0.83 0.56
Firebase 0.53 0.45–0.61 0.62 0.55 0.43
Across tools 0.75 0.79 0.81 0.66

Functional tasks were weakest across the board (0.66), but the shape of failure differs by tool: Claude held steady while Vercel v0 dropped sharply to 0.56 with a wide interval (0.36-0.77). A tool with moderate but stable fidelity is a different risk than one that is unpredictable.


Principle adherence collapses on interaction

Mean PAS ran from 0.29 (Firebase Studio) to 0.73 (ChatGPT). Tools handled structural and styling principles reasonably well and then fell off a cliff: four of five implemented 6% or fewer of the functional principles.

Table 2 - Principle Adherence Score by tool and tier
Tool Mean PAS 95% CI Structural Styling Functional
ChatGPT 0.73 0.59–0.83 0.94 0.88 0.38
Bolt 0.60 0.46–0.73 0.88 0.88 0.06
Vercel v0 0.56 0.42–0.69 0.81 0.81 0.06
Claude 0.54 0.40–0.67 0.81 0.75 0.06
Firebase 0.29 0.18–0.43 0.50 0.38 0.00
Across tools 0.54 0.79 0.74 0.11

Figures
Structural Styling Functional
1.0 0.5 0
0.94
0.88
0.38
0.88
0.88
0.06
0.81
0.81
0.06
0.81
0.75
0.06
0.50
0.38
0.00
ChatGPT Bolt Vercel v0 Claude Firebase
Figure 1. Principle Adherence Score by tier. Four of five tools sit at or below 0.06 on functional principles; Firebase Studio implemented none.

Design Homogenization

Given the same prompt, tools produce narrow differences in visual appearance and layout, while their color choices vary most widely. Claude and Vercel v0 were consistently the closest pair on both visual and color distance.

Table 3 - DHI sub-measures. Lower distance = more similar.
Sub-measure Most similar pair Least similar pair Range Mean
Visual Claude – v0 ChatGPT – Firebase 0.119–0.151 0.137
Color Claude – v0 Bolt – ChatGPT 20.6–39.7 31.9
Layout Bolt – Claude Claude – ChatGPT 0.181–0.211 0.196
Visual
0.119 0.137 0.151
Color
20.6 31.9 39.7
Layout
0.181 0.196 0.211
Figure 2. Spread of pairwise distances per sub-measure. Red ticks mark closest/most-distant pairs; dark tick is the mean.
Authors
Kashif Imteyaz1*

PhD Candidate (*project lead)

Kaif Imteyaz2

Undergraduate Researcher

Nakul Rajpal1

Undergraduate Researcher

Kaif Shaikh3

Graduate Researcher

Northeastern University

1 Northeastern University

United States

Jamia Hamdard

2 Jamia Hamdard

India

Saarland University

3 Saarland University

Germany

4 Independent Researcher

United States

* Corresponding author

Get in Touch

Have suggestions or ideas? Open an issue or pull request on our GitHub repository, or email imteyaz.k@northeastern.edu.

Cite
@article{imteyaz2026design, title={Design Theater: Evaluating the Gap Between User-Facing Design Reasoning and Implementation in Generative UI Tools}, author={Imteyaz, Kashif and Imteyaz, Kaif and Rajpal, Nakul and Shaikh, Kaif and Muller, Michael and Savage, Saiph}, journal={arXiv preprint arXiv:2607.22928}, year={2026} }